

Risk profile is something that is vigorously advocated by investment advisors when it comes to constructing your mutual funds portfolio.
More often than not, the average retail investor has a tendency to downplay the risks attached with equity investing since the returns are so alluring.
This becomes all the more fatal when an investor is heavily or at times completely invested into moderate risk or high risk schemes.
The most common but inaccurate method is by looking at past returns of schemes and investing in them on the basis of it.
The issue with such a method is that it would only showcase how much you would have made in case you done a SIP in a particular Mutual Fund scheme for a particular number of years.
This is because you would only be looking at the average returns over a period of years and as we all are well aware by now, one of the many benefits of doing an equity SIP is rupee cost averaging.
An alternate way to assess your risk profile

Table 1
*L&T Emerging Businesses returns have been calculated for the last 4 years
> Above are the average returns for high risk schemes from 2014-2018.
> This section on Average Returns shows the performance of schemes over a period and not annually.
Birla Value did not give an annual return of 28.96 %
> We have on purpose taken high risk schemes and divided them among four categories to avoid overlapping.
> A major issue with the above table is that because it shows average returns you do not see long periods of negative returns, unfortunately most investors tend to ignore this very important point.
> This is also a very important lesson in why not to invest based purely on past returns.
Now let’s look at another table
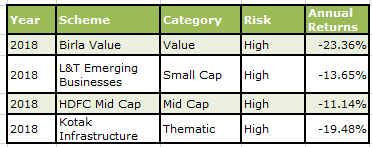
Table 2
Would you have invested in these high risk schemes based on their returns for 2018?
Most likely a strong no!
A major issue with statistics is that they conceal more than they reveal but at times what they conceal is more valuable than what they reveal. No matter how big the house looks from the outside, it is still useless unless you have that small key to access it
Average returns mask high levels and periods of negative returns with higher gains and Annual returns mask high potential in growth with negative returns.
The point being you should not study these in isolation.

Source:ValueResearch
Table 3
*L&T Small cap was only launched in May 2014 so therefore we have taken start date from 1st January 2015
The above table is a very common method applied by investors to calculate how much they would have made in case they had invested during the said period. When you look at the total gain of all the above gains, it is quite understandable why it is indeed such a lure to invest in them.
The table that really matters

‘’When it comes to understanding your risk profile, this is the most important table.’’
> This is despite it showing SIP returns for only one year and you should be looking at a longer term returns history.
> When you look at average returns for the last 5 years it looks really enticing on paper but what it does very conveniently, is cover up long periods of negative returns.
A year should not be long when it comes to equity investing but when it gives you negative returns on a run, even a year seems really long.
Whenever you are pondering over whether you must invest in mid, small, thematic, etc. schemes, basically schemes that have a track record for high returns comparatively,you must look at tables 2 and 3 and do the following:
a) Look at years when they have given negative returns
b) Insert an amount you wish to invest and calculate the losses you would be sitting on
c) Ask yourself if you still wish to invest in them.
*Keep in mind this method will work only if you consider year/years when they have given negative returns and not over say 5/7 years.
> This is because when you look at high risk schemes for a period over 5 years, they tend to average out the under performing periods. Rupee cost averaging is one of the many benefits of an equity SIP since it negates the need to time the market.
> Now after looking at tables 2 and 3 and calculating the losses you would be sitting at after the said period, you need to ask yourself if you would really stay invested in these schemes and be as honest as you can about this.
> If you look at the Mutual Funds inflows history over a good number of years, you would conclude that inflows are heavily influenced by returns. This is neither beneficial for the average retail investor in specific and the economy in general
> Axis Bluechip Fund saw a jump in 93% of its AUM in 2018 whereas category of balanced saw record outflows, it does not take a genius to figure out the trend that is being followed here.
So how does that affect the average retail investor you ask?
> Stopping SIP in a market low when in fact he could be gaining more units at a lower price.
> Not just stopping SIP’s but also redeeming the amount accumulated over a period of time.
> Since SIP’s have been stopped and redeemed, cannot avail compounding benefits.
> Profits made over a year are no more tax exempt and will attract LTCG.
You see the issue with this is quite simple, return oriented investor is more bound to react in a market downturn but a goal oriented investor will stay invested when the market sentiment is low.
In February 2019, Mutual Funds inflows hit a 25 months low, the major contributing factor for this was a very poor 2018 (in returns). Not only were people withdrawing their money, they were stopping their SIP’s.
This was a very counter- productive move,it would have made sense if it were for the following reasons:
> Realizing the scheme is not aligned with your risk appetite.
> You have reached your goal.
> There is a sudden change in fund manager or strategy which you did not sign up for.
Equity SIP’s do not have a season, the very idea of having one is to not bother with market fluctuations. There is absolutely no way to predict when the markets will go up and down precisely, even fund managers have spectacularly failed at it in the past.
Now if the very people who have been trusted with managing your finances getting work this out then why would you attempt this daring yet futile stunt?
If gambling gives you an adrenaline rush then why not give Las Vegas a visit?
SIP’s are for every season but they actually become more attractive when the markets are bleeding. What you need to look for are strong fundamentals, fluctuations in equity markets are a norm and not an aberration.
From 2009 to 2018, both Birla Value Fund and HDFC Mid Cap Fund have given negative returns on annual basis in 2011 and 2018. So basically in 10 years, they gave negative returns for only 2 years which should be seen as a very good record but it’s not that simple.
The effect that negative returns have on the human brain is far more than positive returns. The chances of you redeeming your money in a bear market are more likely than your chances of investing in a bull market.
Have you ever wondered why your teacher used a red ink pen to grade your paper?
This is because errors are expected to be few but nevertheless need to be corrected. A simple tick mark to your answers does not have as much as an impact as encircling to your errors in red. The red colour ink is used to stand out from the rest which is exactly why you were asked to write in another ink colour pen. You were more likely to be curios and reactive to your errors because you expect them to be an aberration than the norm.
This is just how the human brain works, it is more affected by anything negative than positive which is why we humans tend to dig up our past mistakes and offer regret for the same but very rarely do we laugh on repeated jokes.
So why do investors not look at past negative returns of Mutual Fund schemes?
This is due to perceptual blindness, also known as inattentive blindness. The term was used for the first time by Arien Mack and Irvin Rock in their book, Inattentional Blindness.
This phenomenon can occur in any individual, irrespective of age,gender,social status, etc. You see what you are looking for and you cannot see what you are not looking even though it is visible in plain sight.

For the optimistic, this is a half-filled glass
For the pessimistic, this is a half empty glass.
It is the same glass for both sets of viewers and yet they only see what they want to see.
The Clown experiment

Kira Mckenzie, Jenna Caggiano, Breanne Wise, Ira Hyman and Matthew Boss at the Western Washinton University conducted an experiment which involved a coloured clown on a unicycle. The participants were divided into groups that would walk in pairs, listen to their music player or talk on their phones.
The research found out that participants who were talking on their phone were least likely to notice the clown despite it being visible in plain sight, this is because the attention given to talking on one’s phone was far greater than the other activities including noticing the coloured clown.
This is precisely how equity investing works where despite the pitfalls of a short term mindset being spoken about via various mediums several times, you would still find investors lining up to invest, claiming to be long term investors with a long term horizon only to redeem at the slightest hint of a market correction.
This article is by no means to scare you or even discourage you from investing into equity mutual funds but rather to give you a realistic view of how things work.

Looking at negative returns and then calculating an hypothetical amount at the end of the year gives you an idea whether you are equipped to sail through volatile times which are a given with equity markets. This approach is all the more important when you are someone who looks at his/her portfolio daily/weekly or monthly.
When you are so emotionally and attentively involved in your portfolio, a poor year for the markets will make you believe that you were better off with other safe instruments like FD and RD.
Mentioned below is the gradual decrease of inflow into Mutual Funds

Mentioned below is the gradual increase of inflow into Fixed Deposits

> What makes it even worse is when you are invested in aggressive and high risk schemes which tend to fall more than the rest.
> The issue with having a poor returns year with an aggressive portfolio is that you are likely to act on it.
> When your portfolio shows negative returns it means you are sitting on notional losses, when you redeem your portfolio you convert these notional losses into actual losses.
> When your portfolio shows negative returns it means you are sitting on notional losses, when you redeem your portfolio you convert these notional losses into actual losses.
The literal meaning of the term notion is idea or belief.
> So a notional loss means it’s on paper, there is absolutely no guarantee of future performance but as long as it’s on paper, the likelihood of it getting better or worse still exists.
> When you redeem your investments though, you take away this possibility and convert it into something permanent.
> What makes matters worse is if you are a first time investor venturing into the world of mutual funds for the very first time with an aggressive portfolio.
Stop making investments based purely on their returns history, rankings or recommendations from friends, colleagues, relatives, etc. Scheme selections should be the last step in the process and not first.
Your portfolio should consist of schemes that align with your risk profile and not necessarily which are popular.
A smaller sized shoe no matter how popular will eventually cause you immense pain.
A smaller sized shoe no matter how popular will eventually cause you immense pain.
Got some questions ? We've got the answers,
email us at info@themutualfundguide.com
Disclaimer : While due precaution has been undertaken in the preparation of this article, The Mutual Fund Guide or any of its authors will not be held liable for any investments based on the above article. The above article should not be considered financial advice and has been published only for your perusal. Due credit has been given in case wherever required, in case you feel any part violates any rights then do get in touch with us and we shall get it duly removed.
Mutual Fund investments are subject to market risks. Please read the offer document carefully before investing
Copyright © 2019 The Mutual Fund Guide, All rights reserved.


